Villages Do Not Need Another Survey. They Need a Living Asset Register.
JJM built the taps and tanks. The missing piece is the loop that turns a meter reading into a repaired OHT, a balanced village, and proof it happened.
The taps are installed. The OHTs stand over the villages. The scheme meter at the source turns honestly. And still the question every engineer hears at review meetings has no solid answer: which village got its share this week, and what proves it? That gap, between infrastructure built and supply verified, is where rural water credibility is won or lost.
Key takeaways
- The Jal Jeevan Mission built the hardware. The missing piece is the loop that converts a meter reading into a repaired OHT, a balanced village, and proof it happened.
- Maps and surveys end at display. Operations need an asset register where every OHT, valve, and meter carries its readings, its history, and its owner.
- Start narrow: one scheme, three OHTs, four meters. Define who acts on what evidence, run the loop, then federate to the district.
- Measure outcomes, not effort: flag-to-repair time, live balances per OHT, and whether the same shortfall recurs.
The taps exist. The water does not always follow
Credit where it is due: the last few years put taps, tanks, and treatment into villages at a pace nobody thought possible. A district that once tracked schemes on paper now holds scheme maps, asset photographs, and coverage percentages. The display side of the problem is largely solved.
Yet the operating question stays open. A coverage report says the village is connected. It does not say whether the OHT filled on Tuesday. A pipeline map shows the branch layout. It does not say which leg is losing water. A photograph proves the tank was built. It proves nothing about this week's supply. The hardware exists. The evidence of service does not, at least not where anyone can query it.
Scheme figures versus village reality
A scheme meter aggregates honestly and hides faithfully. Source yield looks adequate. Treatment runs its hours. On paper the scheme succeeds while tail villages ration quietly, because averages are where inequity goes to hide.
The contrast that matters is not success versus failure. It is scheme figures versus village reality. The first lives in reports. The second lives at taps. Until the two reconcile village by village, every review meeting argues about impressions: the engineer insists supply ran, the representative insists it did not, and no reading exists to settle it. A living register ends that argument the way a bank statement ends a dispute about money.
The problem is not a lack of maps
Most water data projects follow a familiar chain: survey the assets, build the map, present the dashboard. Understanding improves. Operations continue exactly as before. Three familiar dead ends show why:
An OHT photograph with no level trend tells you the tank exists. It cannot tell you whether it filled, when, or how often it ran dry.
A pipeline alignment with no meter readings shows the network's shape. It cannot tell you which branch loses water or which village draws beyond its share.
A coverage percentage with no supply hours counts connections. It cannot distinguish a tap that runs two hours daily from one that runs twice a month.
In each case the map is the end of the technology workflow. What follows is what always followed: phone calls, field visits on hunches, registers maintained in notebooks, and coordination by memory. The harder challenge was never displaying more. It is closing the loop between a reading and a repair.
One scheme, three villages
Take the smallest meaningful unit: one MVS scheme, three villages, four bulk meters. The old chain runs lift water, assume shares, hear complaints. The new chain runs meter, compare, flag, fix, record:
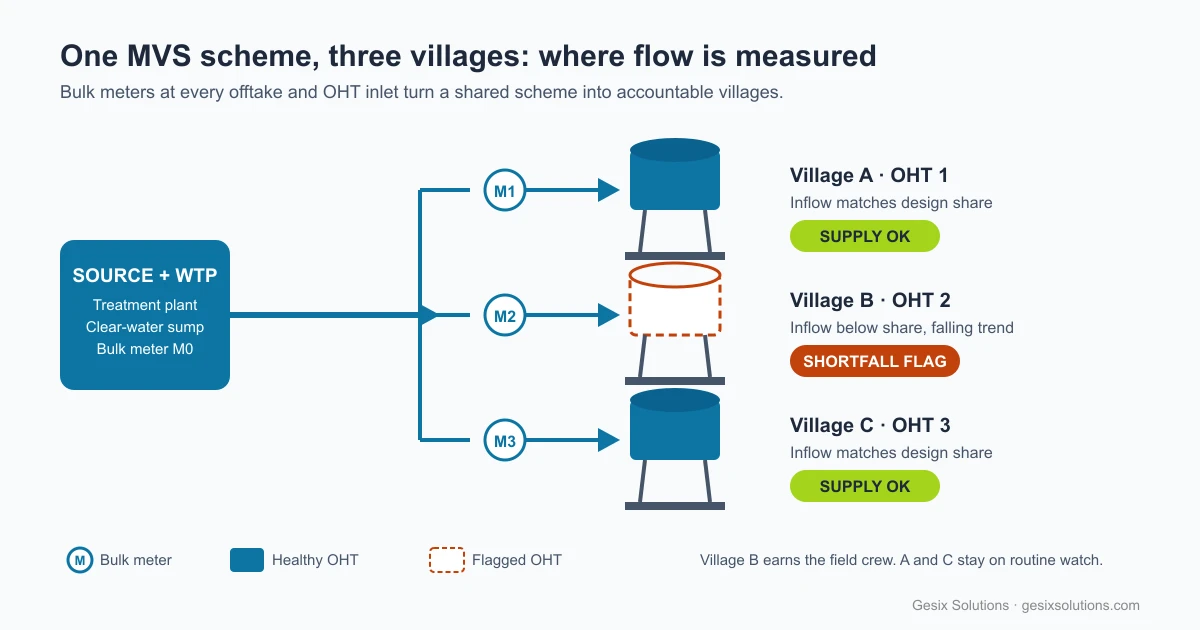
Nothing about this requires new science. The meters are standard. The comparison is arithmetic. What changed is specificity: the system no longer reports that the scheme has a problem. It reports that Village B's OHT inflow slid below allocation while A and C held, which sends one crew to one village with one defined fault. That specificity is the entire difference between a dashboard and an operation. The full mechanics sit in our MVS water post.
Every water problem needs an asset object
A system-wide complaint becomes solvable only when it attaches to something that can be inspected, repaired, replaced, or monitored:
Water shortage in a village attaches to its OHT inlet reading and the offtake meter upstream of it.
Falling supply hours attach to the pump log, the energy bill, and the sump level on the same dates.
A suspected leak attaches to a pipe section between two readings that disagree.
A billing shortfall attaches to the gap between bulk inflow and metered consumption per village.
A JJM functionality query attaches to the village asset holding supply hours, coverage, and test results.
This is the shift from a map-centered setup to an asset-centered one. The register must know not only where the problem sits, but which object is responsible for it and whose job that object is.
The loop, stated plainly
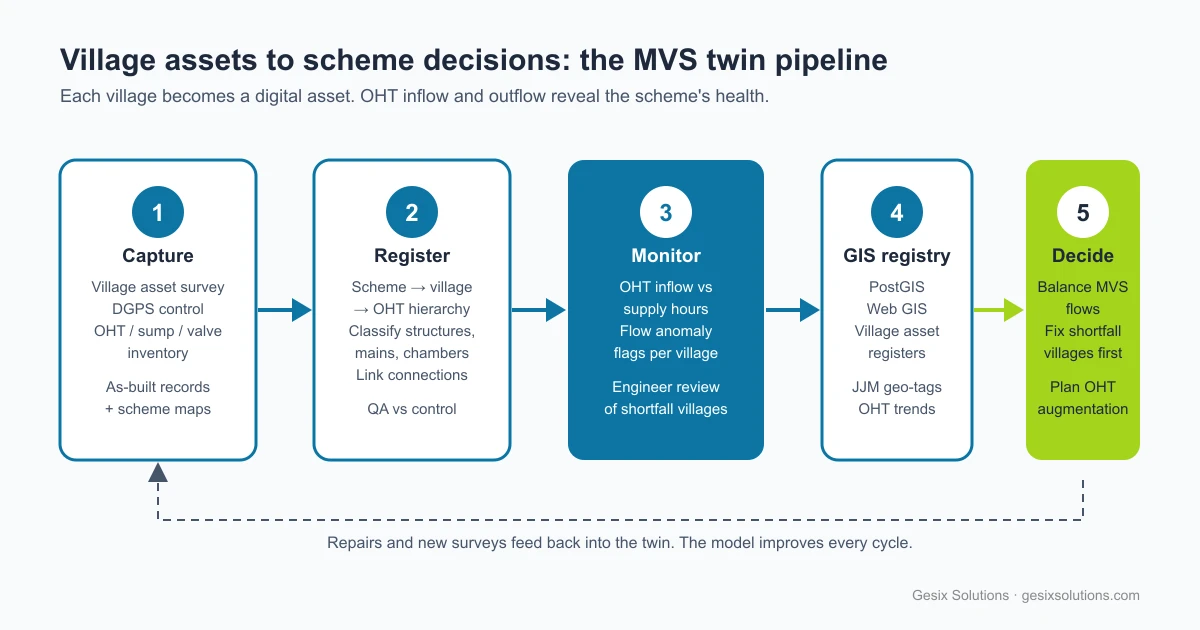
A working loop repeats five moves. Capture fixes positions. Registration gives every asset an address. Monitoring compares readings against allocation and history. Decisions assign the flagged village and authorize the work. Recording writes the repair back so next month's data proves it held. Most projects fund the first two moves and wonder why nothing changes. The value lives in the last three.
Judge the loop by outcome measures, not effort measures. Sensor counts and dashboard logins describe spending. These describe results: hours from flag to repair, share of OHTs with live inflow balances, whether the same shortfall recurs after intervention, and before-and-after readings that show the fix worked.
Who gets to act on a reading
Analytics alone settles nothing, because a recommendation is only as useful as the authority behind it. Not every observation should trigger the same response. A workable register classifies evidence by what it permits:
| Tier | Example | Permitted use |
|---|---|---|
| Field note | Operator reports low pressure in one street | Context only, never formal action |
| Meter log | Bulk readings show a village below allocation | Inspection and diagnosis |
| Calibrated reading | Verified inflow against design share, with history | Authorized repair spending and shutdowns |
An AI flag from combined level, flow, and history data earns a crew visit on the strength of a meter log. Closing a valve that cuts supply to a village, or sanctioning a replacement, needs the calibrated tier with its provenance intact: which meter, which dates, whose approval, what the re-reading showed. As models enter rural operations, this discipline matters more, not less. The register keeps the approval trail, not just the recommendation. Zone practice here follows the same IWA water-balance discipline utilities use to separate real losses from apparent ones.
Start with three OHTs, not the district
The phrase "district water twin" frightens finance officers, and it should. Modelled as one giant platform covering every scheme, asset, and department, it gets expensive before it gets useful. There is a cheaper path. Pick one scheme with chronic imbalance. Define its villages, its OHTs, its meters, its decision rules, who responds, and what evidence closes a case. Run that loop for two supply cycles. Then copy it.
Once several loops run, they share the same spatial foundation, the same asset identities, the same evidence tiers. The district twin grows out of proven routines instead of arriving as one large purchase. Federation through demonstrated value beats installation through ambition. Our digital twin development follows exactly this order: one operating loop first, the platform second.
Reported coverage versus functional supply
The sector keeps promising actionable intelligence, a phrase now stretched to cover anything that looks vaguely useful. Rural water deserves a sharper line.
Reported coverage says: the taps exist.
Functional supply says: this OHT delivered these hours at these levels to these habitations, and here is the log.
The next generation of rural water systems will not be defined by how much infrastructure a district can display. It will be defined by how reliably a reading becomes a repair, and how rarely the same village appears in the complaint register twice. A village does not get water because its pipes are visible on a map. It gets water because someone measured its share, noticed the shortfall, and fixed it before the next review meeting had to ask.
Frequently Asked Questions
What is an intervention loop in rural water supply?
A repeatable sequence from evidence to verified action: meter the inflow, compare it against allocation and history, assign the shortfall village, repair, and record the result back into the asset register so next month's readings prove it worked.
Why do water maps and surveys fail to change operations?
Because they end at display. An OHT photograph with no level trend, a pipeline map with no meter readings, and a coverage report with no supply hours all describe the system without telling anyone what to do next, where, or by when.
Who should be allowed to act on a meter reading?
It depends on the evidence tier. A field note informs, a bulk-meter log triggers inspection, and a calibrated reading against design allocation authorizes spending and shutdowns. The register should record which tier each decision rested on.
How should a utility start building this loop?
Narrow: one MVS scheme, three OHTs, four bulk meters. Define the assets, the decision rules, who responds, and what evidence closes the case. Federate to the district only after that loop runs reliably.
How is success measured?
Time from flag to repair, share of OHTs with live inflow balances, recurrence of the same shortfall after intervention, and before-and-after readings. Sensor counts and dashboard views measure effort. These measure outcomes.