Monitoring OHT Flow Across Multi-Village Schemes With a Village Digital Asset
An MVS scheme succeeds village by village. Here is how a surveyed digital asset per village plus bulk metering at every OHT turns scheme flow into accountable, reportable supply.
A Multi-Village Scheme can look healthy on paper while individual villages go short. The scheme meter spins normally, the treatment plant runs, yet two villages down the branch line get half their share. The gap between scheme figures and village reality is where utilities lose water and trust together. Closing it takes two things: a digital asset for every village, and a meter on every OHT that matters.
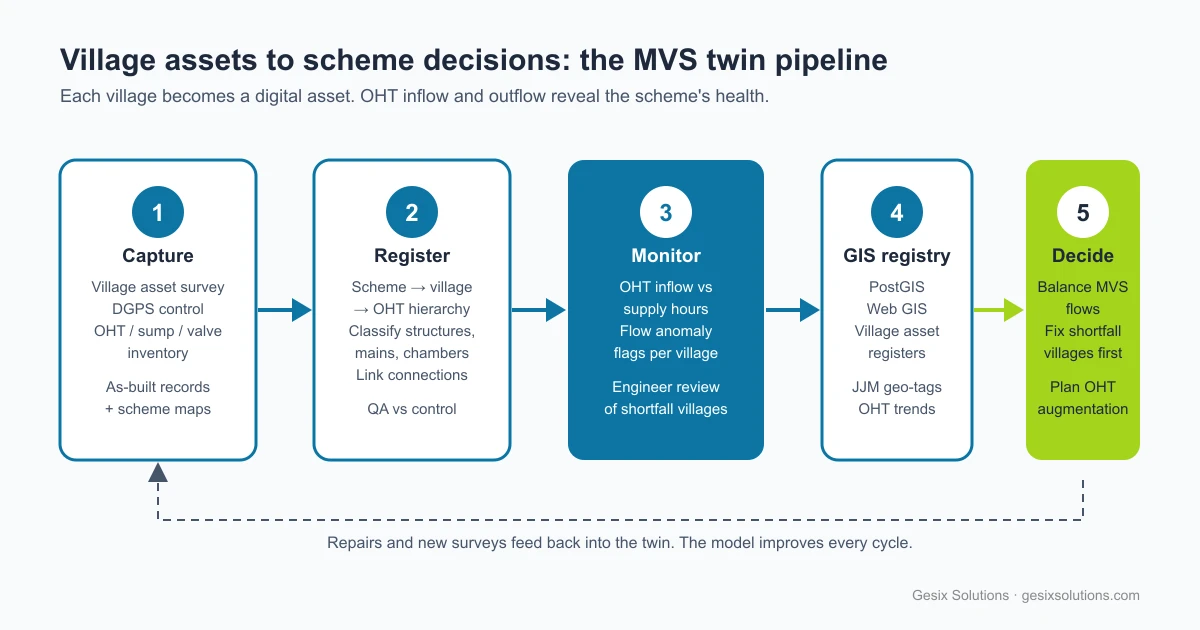
Key takeaways
- Run water village by village, not scheme by scheme. Give each village a surveyed digital asset (OHTs, sump, valves, meters, connections, history) nested inside its parent MVS scheme.
- Put bulk meters at the source, at each village offtake, and at each OHT inlet. Shared flow becomes accountable shares, and shortfalls show up as data instead of complaints.
- Compare inflow against design allocation and against history. That comparison catches unfair supply, rising loss, and failing assets early enough to act.
- The same asset feeds Jal Jeevan Mission functionality reporting, so supply hours, coverage, and OHT performance become exports rather than emergency surveys.
Why the village, not the scheme, is the unit that matters
MVS schemes get designed on spreadsheets. Source yield divided by villages, per-capita norms times census figures, OHT capacities sized to match. Then operations discover what the spreadsheet hid. Villages near the source draw generously. Tail villages receive whatever pressure is left. One unauthorised connection here, a choked branch there, a valve left half-open after last month's repair, and the design shares drift without anyone noticing.
A scheme-level meter cannot see any of this. It reads correctly while tail villages ration. So accountability has to move one level down, to the village offtake, and one level further, to the OHT inlet. Measure where the water changes hands. In rural supply, that means the village boundary and the tank inlet.
What a village digital asset holds
Forget 3D showcases. Nobody needs to admire a pipe in three dimensions. What the utility needs is a spatial register where every asset, reading, and repair has an address:
| Asset | Captured how | Watched how |
|---|---|---|
| OHTs (capacity, staging, condition) | DGPS position plus structural survey | Inlet bulk meter, plus level trend where gauged |
| Sump and pump house | DGPS plus as-built reconciliation | Pumping hours and energy set against volume lifted |
| Valves and chambers | DGPS inventory with open/closed state | Logged at every operation, never remembered |
| Rising and gravity mains | Reconciled as-builts, GPR where records fail | Zone balance of offtake meter versus OHT inlets |
| Household connections and meters | Connection survey mapped to habitations | Billed versus supplied, per village |
| Supply history | Operations log anchored to the asset | Hours of supply, quantity, quality tests |
We build this on open tooling, QGIS, PostGIS, and GeoServer, because a district should own its own villages' data. That is how our geospatial engineering practice delivers it. The survey discipline behind the coordinates lives in our advanced surveying notes.
Reading OHT flow across one MVS scheme
Picture one scheme feeding three villages. Each village has an OHT. Each offtake and each tank inlet carries a bulk meter. The arithmetic does the monitoring:
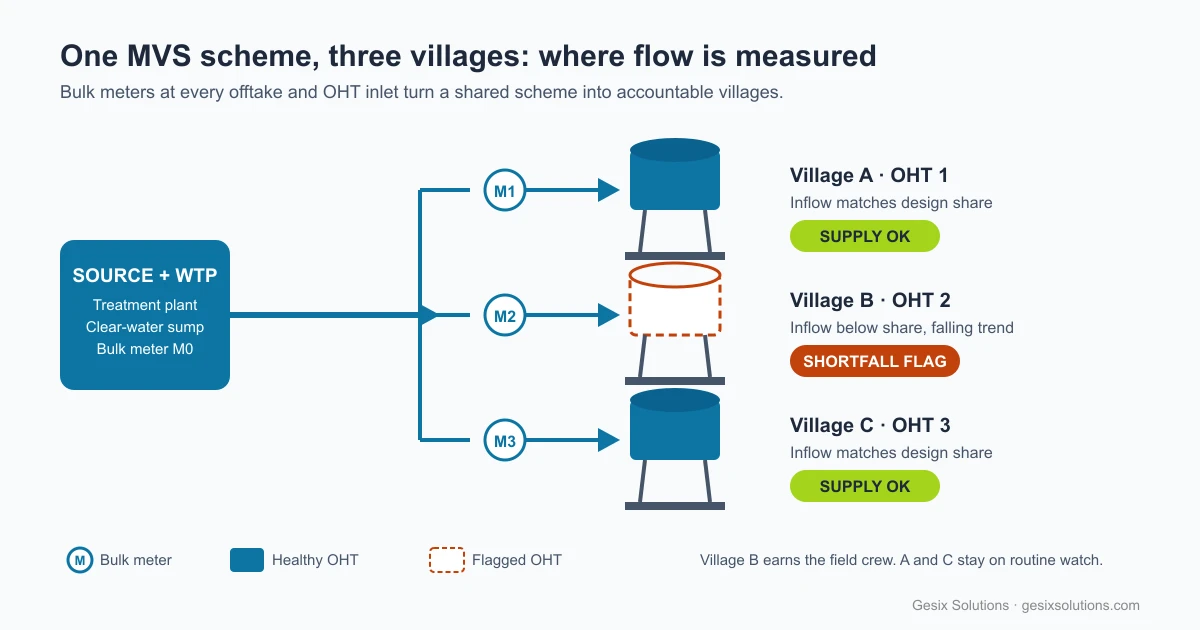
Meter M0 at the source states what the scheme lifts. Meters M1 to M3 state what each village receives. The OHT inlet readings state what each tank actually stores against its design share. When Village B's inflow slides below allocation while A and C hold steady, the twin flags it before residents start calling. The field crew then drives to one village with a defined problem instead of patrolling three with a vague one. The zoning follows standard IWA water-balance practice for separating real losses from apparent ones, applied here at village grain instead of city DMA grain.
What the balance tells you
| Signal | What it usually means | What to do |
|---|---|---|
| One village sliding against its own history | Leak, unauthorised draw, or choked branch on that leg | Walk that leg acoustically, nowhere else |
| All villages sliding together | Source or treatment shortfall, pump wearing out | Check source yield and pump performance first |
| OHT fills but supply hours fall | Loss below the tank, or valves mismanaged | Audit the gravity network and the valve log |
| Night inflow with no legitimate demand | Steady leak or bypass on the rising main | Step-test the main, then dig exactly once |
| Inflow fine, per-capita supply low | Connections outgrew the OHT, or staging too low for tail habitations | Plan OHT augmentation, not just more water |
Notice what is missing from that table: digging as investigation. Each row settles the question before a trench opens. Our water-network survey operations cover 2,500 km of mapped networks, and UAV LiDAR has cut inspection field time there by 42% against traditional methods (project-reported figures; the full comparison is in our UAV vs LiDAR piece). The lesson repeats everywhere: measurement shrinks the search area until repair becomes routine.
JJM functionality reporting becomes an export
JJM moved the goalposts in the right direction, from connections created to functionality delivered. Taps giving adequate, regular, prescribed-quality water under the 55-lpcd service norm. That question only makes sense village by village, and only a village-grain asset can answer it without a scramble. Supply hours per village, OHT performance per tank, coverage per habitation, quality tests per source. The twin holds all four, so the report gets compiled instead of commissioned.
Build the asset while the scheme gets built and it costs little more than disciplined paperwork on work already happening. Coordinates as chambers go up, materials as pipes go down, meters as connections get sanctioned. Our digital twin development work treats this as a standing rule. The twin is not a second project. It is the record of the first one, kept alive by every meter reading that flows into it.
Frequently Asked Questions
What is a village digital asset in a water scheme?
A surveyed, GIS-held record of one village's water system: its OHTs with capacity and staging height, sump, valves, bulk and household meters, pipeline geometry, connections, and supply history, all addressable inside the parent MVS scheme.
What is an MVS scheme?
A Multi-Village Scheme under the Jal Jeevan Mission: one source and treatment setup feeding several villages through a shared pumping and gravity network. Balancing flow between its villages is the scheme's central operating problem.
How does OHT flow monitoring work?
Bulk meters at the scheme source (M0), at each village offtake, and at OHT inlets log inflow per village. Comparing each village's share against its design allocation, and against its own history, flags shortfalls, rising losses, and unfair distribution.
How does this help JJM functionality reporting?
JJM tracks functionality: taps delivering adequate, regular, prescribed-quality water under the 55-lpcd service norm. A village asset holding supply hours, OHT levels, and coverage lets the utility export that evidence instead of re-surveying under deadline.
What is the first step for a utility with no records?
Fix everything visible. Take DGPS coordinates for every OHT, sump, valve, and meter, and reconcile them against as-built drawings and scheme maps. That surveyed anchor set is the skeleton of the digital asset. Metering and history attach to it afterward.